Governing AI Economics: Cost, Value and Portfolio Decisions
Chapter 16 gave the AI portfolio a version-controlled register, falsifiable value hypotheses and evidence-gated funding tranches. This companion chapter answers the question that register exists to settle: whether to fund, continue, scale, constrain or stop an AI system when its costs are variable and its benefits uncertain. Classical IT investment appraisal assumed a licence fee known in advance and a benefit estimated once. Neither holds for systems built on large language models, whose cost follows consumption and whose benefit is a hypothesis until measured in production. The chapter treats this as a governance problem: who owns the money, what evidence each decision needs, which gates an investment passes through, how to compare an AI system fairly with the alternatives, and how public bodies should think about value when success cannot be a margin. Metering, quotas, routing and caching appear only as controls that a decision depends on.
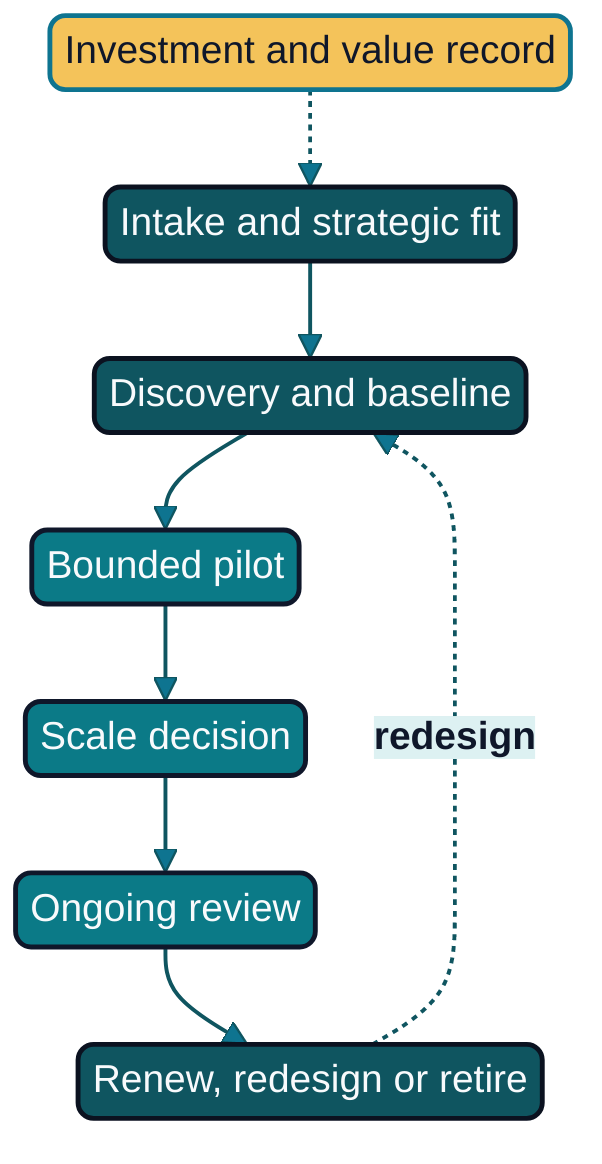
Figure 16A.1: The investment gate lifecycle. Every gate reads the same investment and value record and consumes measured cost and value evidence; a threshold or stop condition constrains or stops the system and updates the record.
Why AI costs run away
A conventional application costs roughly the same to run whether it is used lightly or heavily. A system built on a large language model is priced by what it consumes, and that is decided at run time by the length of each request, the model that answers it, the number of attempts and the number of users. The FinOps Foundation lists the pricing models an organisation meets: on-demand pricing per token, call or hour; provisioned capacity billed whether used or not; and commitment discounts (207, FinOps Foundation, 2026). An organisation that budgets for AI as for office software will be surprised either by a bill it did not forecast or by reserved capacity it did not use. Each driver of variability needs its own control.
- Token and request volumes. Applications add system prompts, conversation history and retrieved content to every call (207, FinOps Foundation, 2026), so the cost of a question depends on how the application was built, not only on the question.
- Long contexts and reasoning. Providers price input and output tokens separately and add metering for cached context, reasoning traces and embedded media (209, Storment, 2026); a model that reasons at length produces tokens the user never sees but the organisation pays for.
- Retries and agent loops. Storment observes that a query routed through a retrieval pipeline with a reasoning model and three tool calls may consume one to two orders of magnitude more tokens than a direct prompt to a smaller model, and he names this non-linearity as the principal reason traditional cost forecasts have proven unreliable for AI workloads (209, Storment, 2026). The FinOps guidance accordingly tells practitioners to watch for agent loops, prompt changes that double token use and model switches that change price (207, FinOps Foundation, 2026). The OWASP Top 10 for Agentic Applications lists loop amplification, in which a planner repeatedly calls costly tools and causes denial of service or bill spikes (84, OWASP, 2025), and the OWASP Top 10 for LLM Applications names unbounded consumption, including "denial of wallet", in which an attacker exploits pay-per-use pricing (38, OWASP, 2025). Cost is therefore also a security property.
- Model choice and capacity. The same task can be served by models whose prices differ by an order of magnitude. Provisioned throughput turns a variable cost into a fixed one, but low utilisation can make it cost more per token than on-demand use (207, FinOps Foundation, 2026); Chapter 20 catalogued GPU hoarding as the result.
- Data, assurance and human review. Retrieval indexes, evaluation datasets, the logging required by Article 12 and the log retention required by Article 19 and Article 26(6) of Regulation (EU) 2024/1689, the AI Act (1, European Union, 2024), evaluation, red teaming and the hours of staff who review output are costs of operating the system, and belong in the business case.
- Supplier pricing and lifecycle changes. Stanford's AI Index reports that the inference cost for a system performing at the level of GPT-3.5 fell more than 280-fold between November 2022 and October 2024 (60, Stanford HAI, 2025), whereas the Linux Foundation's Tokenomics Foundation announcement of June 2026 observes that per-token costs, having fallen heavily during 2023 to 2025, have levelled off and that new model token prices are rising (210, Linux Foundation, 2026). Hosted models are retired on the provider's schedule, forcing migrations every one to two years (113, OpenAI, 2026), (114, Microsoft, 2026), each with a re-evaluation cost.
- Operating and retiring. Sculley and colleagues showed that machine learning systems accumulate hidden technical debt in data dependencies, configuration and monitoring (48, Sculley et al., 2015), and the NIST AI Risk Management Framework asks organisations to have processes for decommissioning AI systems safely (GOVERN 1.7) (36, NIST, 2023). Chapter 20's model nobody retires is what happens when that cost was never budgeted.
Token economics, in the language of the sources
"Tokenomics" also names the economics of cryptocurrency, with which this subject has nothing to do. Storment defines token economics as the discipline through which AI consumption is metered, attributed and connected to business outcomes, a token in AI being a unit of computation, not of ownership (209, Storment, 2026), and this book uses the term in that sense only. FinOps, in the Foundation's definition, is an operational framework and cultural practice that maximises the business value of technology and creates financial accountability through collaboration between engineering, finance and business teams (208, FinOps Foundation, n.d.). The Foundation's 2026 survey shows how quickly this became mainstream: 98 per cent of respondents managed AI spend, up from 31 per cent two years earlier, and the challenges they named were visibility, allocation and determining AI value (211, FinOps Foundation, 2026).
What belongs to the platform
The controls that make token economics enforceable are technical: a gateway that attributes every call to a use case and cost centre, quotas per application and agent, routing to the smallest adequate model, caching, hard spending caps with a fallback, and showback reports, alongside the energy accounting that Chapter 4's eighth principle requires. The governance question asked of each is narrower: who decided the limit, on what evidence, and what happens when it is reached.
Why a demonstration is not evidence of value
A research team at MIT's Project NANDA, reporting in July 2025 on over 300 publicly disclosed AI initiatives, 52 interviews and a survey of 153 senior leaders, found that despite enterprise investment of 30 to 40 billion dollars in generative AI, 95 per cent of organisations in its sample were getting no measurable return (212, Challapally et al., 2025). The authors call their figures directionally accurate, based on interviews rather than company reporting, so the number is a warning about method rather than a failure rate. The method failure it identifies is instructive: budgets followed the functions where outcomes were easiest to attribute, and tools were evaluated on software benchmarks rather than business outcomes.
A demonstration proves that a system can produce an output, not that the output is used, is right often enough, displaces work rather than adding a review step, or serves the people it affects. Four disciplines turn a demonstration into evidence.
Define a unit of service or outcome. A cost per token is a price, not a value. The FinOps Foundation advises measuring cost per inference, per user and per successful outcome for each use case, reported as distributions (207, FinOps Foundation, 2026). Storment adds token yield rate, the share of generated tokens that contributed to a downstream business action after accounting for retries, abandoned sessions and outputs that failed quality review (209, Storment, 2026). For a forum the unit must be something the business recognises: a standard letter sent, a claim correctly routed, a resident's enquiry resolved. The NIST framework requires that the business value is clearly defined (MAP 1.4) and the potential benefits documented (MAP 3.1) (36, NIST, 2023).
Compare against a credible baseline. HM Treasury's Green Book calls the baseline business as usual, the outcome expected if current arrangements continue, and warns that overestimating its costs makes intervention appear unduly attractive (213, HM Treasury, 2026). The European Commission's Economic Appraisal Vademecum builds every method on the same with-and-without comparison (214, European Commission, 2021). For an AI system, the baseline is the measured current process, errors and waiting times included; a benefit claimed without a recorded baseline is an assertion.
Count the full lifecycle and the human costs. The NIST framework asks organisations to document potential costs, including non-monetary costs, of expected or realised AI errors (MAP 3.2) (36, NIST, 2023): the reviewer who checks every draft, the complaints handler, the evaluation suite, the exit plan and the retirement. A business case that counts inference and nothing else compares the cost of the engine with the value of the journey.
Weigh quality, risk, accessibility and public value. A system that is cheaper per letter but needs more corrections has moved cost, not removed it; one that concentrates dependence on one supplier has bought the resilience risk Chapter 7 priced; and a citizen-facing assistant unusable by residents with impaired sight fails the accessibility requirement Chapter 10 treated as part of fairness. The Green Book weighs monetisable and unmonetisable costs and benefits together and defines social value as all the benefits, costs and risks that affect people's wellbeing (213, HM Treasury, 2026).
Worked example: three units of value
Illustrative example. Each unit below is something the business owner already counts, has a recorded baseline, and carries a quality constraint so that it cannot be improved by lowering the standard.
| System | Unit of value | Baseline | Quality constraint |
|---|---|---|---|
| Nordvik Region internal staff assistant (UC-2026-061) | Standard letter drafted and approved | 27.0 minutes per letter in the comparison group | Second-line queries not above baseline plus 10 per cent |
| Hansa Mutual claims correspondence assistant (UC-2026-031) | Routine claims reply sent | 14.2 minutes handling time; complaint rate 0.021 | Complaint rate held; override rate 5 to 20 per cent |
| Hansa Mutual claims assistant (AIDR-0021) | Policy question answered with a cited source | Handler search time before the pilot | Faithfulness above threshold; cost per answer under the EUR 0.04 budget |
The third row reuses Chapter 5's pilot readiness checklist, where a cost per answer of EUR 0.031 against that budget scored four out of four. Without a unit of value, the only number the forum can discuss is the invoice.
Who owns the money and who decides
Cost governance fails most often for lack of an owner, not of data: the platform team sees the invoice, the business unit the benefit, and finance neither until the quarter closes. The governance task is to say which role holds which decision and to record it in the decision-rights file that Chapter 16 placed beside each forum's terms of reference.
| Role | Owns | Decides |
|---|---|---|
| Executive sponsor | Strategic fit and risk appetite | Intake above the delegated threshold; renewal or retirement of strategic systems |
| Product or service owner | Value hypothesis, unit of value, benefit measures | Scope changes within the envelope; the request to scale |
| Finance and FinOps | Cost envelope, forecast method, allocation rules | Showback and chargeback design; acceptance of forecast revisions |
| Procurement | Supplier terms, price-change and exit clauses | Admissible sourcing options; renewal terms |
| Architecture | Model choice, routing, caching, second source | Design that determines unit cost; readiness to scale |
| Risk, legal and data protection | Classification, lawful basis, residual risk | Whether the system may proceed at each gate |
| Operations and oversight staff | Monitoring, review capacity, the stop path | Executing a stop within delegated authority |
Two rules keep the table honest. The budget owner is one named person, usually the product or service owner, who answers for the envelope and the benefit together, so that nobody books the benefit while someone else explains the overspend. And the stop authority is delegated downwards: operations may halt a system that breaches a hard threshold without convening anyone, as Chapter 13 provides for incidents, and the forum reviews the stop afterwards.
The investment gate lifecycle
The economic gates sit on the lifecycle transitions of Chapter 16 and ask at each whether the evidence justifies the next tranche, and on what conditions. The NIST framework describes the same cadence: a determination whether the system achieves its purposes and whether deployment should proceed (MANAGE 1.1), and mechanisms to supersede, disengage or deactivate systems inconsistent with intended use (MANAGE 2.4) (36, NIST, 2023).
| Gate | Question | Evidence required | Typical tier (Chapter 13) |
|---|---|---|---|
| Intake and strategic fit | Which objective, which alternatives, what would we stop doing? | Unit of value; baseline planned; options including non-AI and do nothing; usage mode and risk class | Tier 1 below threshold; Tier 3 above or if high-risk |
| Discovery and baseline | What does the current process cost and deliver? | Measured baseline; legal basis; forecast range with assumptions | Tier 1 or 2 |
| Bounded pilot | Is the unit of value delivered within the envelope, quality held? | Unit cost distribution; benefit in a comparison group; dis-benefits; stop conditions tested | Tier 2 or 3 |
| Scale decision | Will unit economics hold, and is the high case affordable? | Scaled forecast with confidence; exit plan costed; consultation recorded | Tier 3; Tier 4 above appetite |
| Ongoing review | Is the hypothesis supported and spend inside the envelope? | Monthly cost and value report; forecast error; alerts; supplier notices | Tier 1 by exception; Tier 3 at review date |
| Renewal, redesign or retirement | Continue, rebuild or stop, and at what cost? | Realised value; renewal terms; alternatives re-compared; decommissioning cost | Tier 3; Tier 4 if strategic |
The gates are deliberately asymmetric. Early gates are cheap to pass and to fail, and a pilot that misses its unit-cost target is a result, not a scandal. The scale gate commits the money, and there the Green Book's warning about optimism bias, the proven tendency of appraisals to overstate benefits and understate costs and durations (213, HM Treasury, 2026), applies with most force. An organisation that has run several pilots can correct for it by applying its historical forecast error to the next forecast.
Controls that keep spend inside intent
The minimum controls for a system whose cost follows consumption are recorded in one investment and value record, so that the forum, the pipeline and the auditor read the same numbers.
- A named budget owner holding the envelope and the benefit measures.
- A cost envelope for the period: what the organisation has decided to spend, distinct from the forecast of what it will spend. The envelope is a decision; the forecast is an estimate.
- Forecast ranges with recorded assumptions and the previous period's forecast error. AI forecasts are less predictable than cloud forecasts and need shorter windows and more frequent revisions (207, FinOps Foundation, 2026).
- Usage and spend thresholds. A soft threshold notifies the budget owner; a hard threshold triggers the platform's fallback. OWASP's mitigations for unbounded consumption, such as quotas, throttling and anomaly detection (38, OWASP, 2025), protect the budget from an agent loop and from an attacker alike.
- Approval gates for changes that alter cost materially: a larger model, a higher quota, a wider population, a new agent tool or a capacity commitment.
- Tagging and allocation, mapping each API key to one team, application and cost centre, with showback before chargeback, because visibility alone often changes behaviour (207, FinOps Foundation, 2026).
- Unit economics reported with outcomes, as distributions, and stop conditions written at intake with the role that may pause the system.
Worked example: AI investment and value record
Illustrative example. Hansa Mutual keeps one investment and value record per use case beside the portfolio entry of Chapter 16. This one belongs to the claims correspondence assistant, UC-2026-031; the pipeline validates it, fills the realised block from the evidence directory each month, and raises the alerts the thresholds define.
# portfolio/value/UC-2026-031.yaml
use_case: UC-2026-031                  # claims correspondence drafting assistant
budget_owner: Head of Claims Operations
finance_partner: Group FinOps lead
usage_mode: 4                           # built AI application, Chapter 2
cost_envelope:
  period: 2027-01-01/2027-12-31
  amount_eur: 540000                    # run cost: platform charge, inference, review time
  forecast_range_eur: {low: 410000, expected: 470000, high: 560000}
  forecast_assumptions:
    handlers_with_access: 1900
    tokens_per_reply_p50: 6200
    retry_rate: 0.08
    model_price_basis: "price list of 2026-10-01, no change assumed"
  previous_forecast_error: "+14 % (2026 expected vs actual)"
unit_of_value:
  name: routine claims reply sent after handler review
  baseline: {handling_time_minutes: 14.2, complaint_rate: 0.021, source: "2026-Q1 measured"}
  cost_per_unit_eur: {p50: 0.21, p90: 0.47}
realised:
  period: 2026-Q3
  handling_time_minutes: 9.6
  complaint_rate: 0.020
  confidence: medium                   # lagging indicator has one quarter of data
thresholds:
  spend_soft_alert: 80 % of envelope consumed before 1 October
  spend_hard_stop: 100 % of envelope, fallback to search-only mode
  unit_cost_p90_eur: 0.60
  quality_floor: complaint_rate <= 0.024 in any week
stop_conditions:
  - quality_floor breached in two consecutive weeks
  - spend_hard_stop reached
  - supplier model retired without an evaluated replacement
stop_authority: [claims-platform-on-call, Head of Claims Operations]
review: {cadence: monthly, reopen_on: [supplier price change, model change, population change > 20 %]}
The forecast range sits beside the previous forecast error, so that the forum can judge the forecast by the record of the people making it. confidence is stated for the realised benefit, because a lagging indicator with one quarter of data is weaker evidence than a leading indicator with twelve. And stop_authority names the on-call role first, because the hard stop is executed by people who can act within minutes and reviewed by a forum that meets within weeks.
Practical guide: setting a cost envelope and stop conditions
Purpose. Govern spend by a decision taken before money is committed, not by an invoice discovered afterwards.
Roles. Budget owner; finance or FinOps partner; the system's architect; risk owner; the operations lead who will hold the stop authority.
Steps.
- Fix the unit of value and the baseline with the benefit owner. If no baseline exists, the first tranche buys the baseline, not the system.
- Build low, expected and high forecast cases from stated assumptions, using the forecasting guide below.
- Set the envelope at or near the high case for a pilot, and at the expected case plus the previous forecast error once the system operates. Record the reason.
- Set a soft alert at 80 per cent of the envelope consumed before 80 per cent of the period has elapsed, and a hard stop at 100 per cent with a defined fallback: a cheaper model, a reduced scope or search-only mode. A system that supports a statutory service needs a fallback that keeps the service running; adapt both thresholds to the risk appetite.
- Pair a unit-cost ceiling at the ninetieth percentile with a quality floor, because a unit cost that falls because quality was lowered is a breach, not a saving.
- Name the stop authority, with the on-call role able to execute the hard stop alone and the budget owner informed within one hour.
- Register API keys, agent identities and reserved capacity against the cost centre before the first request.
- Agree the events that reopen the record: a supplier price or model change, a population change above 20 per cent, a change of usage mode, or a forecast error above 25 per cent.
Codified artefact. The investment and value record above, read by the gateway's quota configuration.
Definition of done. The record is merged, thresholds alert the named roles, the stop path has been exercised once outside production, and the first showback report has reached the budget owner.
Practical guide: forecasting AI consumption with stated assumptions
Purpose. Produce a forecast in which every figure traces to a recorded assumption, so that the forum sees why it moved and the owner learns from its error.
Roles. FinOps partner (method); product or service owner (population and usage); architect (tokens, model mix, retries); procurement (price basis).
Steps.
- Take the population from a system of record: users with access or, for an agent, business events per day.
- Take requests per user or actions per event, and tokens per request at the median and ninetieth percentile, from last period's gateway logs; mark any without production data as low confidence.
- Record the retry rate, the model mix and the dated price basis.
- Cost each request as mean tokens times blended price times one plus the retry rate. Use the mean, because the tail is billed too.
- Build the expected case from measured values, the low case from lower estimates, and the high case from upper estimates with one and a half times the measured retry rate.
- Forecast provisioned capacity as a fixed line and only the overflow as variable; flag a block below 60 per cent utilisation.
- Record each period's error with its sign. Where actuals ran high, set the next envelope at expected plus that error; a persistent one-way bias marks a faulty assumption.
- Revise monthly while the error exceeds 15 per cent, and always for Mode 5.
Codified artefact. One forecast file per system and period, cited by the investment and value record.
Definition of done. Every case recomputes from the recorded assumptions, the price basis is dated, the previous error is recorded, and the FinOps partner has approved.
Worked example: consumption forecast for an autonomous agent
Illustrative example. Hansa Mutual's claims-triage agent, UC-2026-014, is a Mode 5 autonomous production agent governed by AIDR-0024, working through the Polish service centre for the German, Dutch, Swedish and Norwegian markets.
# portfolio/forecasts/UC-2026-014-2027Q1.yaml
use_case: UC-2026-014                   # claims-triage agent, AIDR-0024
period: 2027-01-04/2027-04-04           # 91 days
markets: [DE, NL, SE, NO]               # through the Polish service centre
assumptions:
  claims_per_day: 1500
  actions_per_claim: 2.6
  tokens_per_action: {p50: 125000, p90: 285000, mean: 145000}
  retry_rate: 0.08
  model_mix: {compact-tier: 0.70, large-tier: 0.30}
  blended_eur_per_million_tokens: 1.339
  price_basis: "supplier price lists of 2026-10-01, no change assumed"
cases_eur: {low: 61900, expected: 74500, high: 89200}
previous_forecast_error: {period: 2026-Q3, error: "+13 %"}   # retries on scanned documents
consumption_envelope:
  weekly_eur: 6500
  quarterly_eur: 84500
  daily_hard_cap_eur: 1300              # gateway; fallback: handler triage queue
cost_per_completed_action_eur: {p50: 0.18, p90: 0.41, p90_ceiling: 0.60}
review: {forecast_revision: monthly, envelope_review: AI Governance Board, quarterly}
The unit-cost target governs the median, EUR 0.18, but the bill follows the mean, EUR 0.21, so a forecast built on the median would understate the quarter by about 14 per cent. The envelope is the expected case of EUR 74,500 plus the 13 per cent by which the last forecast ran low, EUR 84,185, rounded up to EUR 6,500 a week. A surge therefore reaches the soft alert and a decision rather than an overspend, and the daily cap of EUR 1,300, 1.6 times expected daily spend, stops a loop within a day.
Worked example: allocation map and showback excerpt
Illustrative example. Hansa Mutual's group AI platform is funded centrally and charged to the national entities, showback quarterly and chargeback annually by consumption. The gateway and the showback report read the same allocation map.
# finops/allocation/ai-platform.yaml  (excerpt)
platform: hansa-group-ai-platform
allocation_owner: Group FinOps lead
consumption:
  rule: each identity maps to one use case, team, entity and cost centre
  unmapped_identity: refused at the gateway
fixed_share:                            # control plane, funded by all entities
  quarterly_cost_eur: 180000
  key: {DE: 0.34, NL: 0.14, SE: 0.12, PL: 0.10, NO: 0.10, UK: 0.12, CH: 0.08}
unallocated_pool:
  owner: AI platform product owner
  ceiling: 5 % of quarterly platform spend   # breach goes to the AI Governance Board
identities:
  - {id: key-correspondence-nl, use_case: UC-2026-031, entity: NL, cost_centre: CC-NL-3120}
  # triage agent: operated from PL, charged to the market of each claim
  - {id: agent-claims-triage-de, use_case: UC-2026-014, team: triage-operators-pl, entity: DE, cost_centre: CC-DE-4420}
  - {id: agent-claims-triage-no, use_case: UC-2026-014, team: triage-operators-pl, entity: NO, cost_centre: CC-NO-6020}
| Entity | Consumption (EUR) | Fixed share (EUR) | Share of spend | Change on previous quarter |
|---|---|---|---|---|
| Germany | 268,000 | 61,200 | 40.2 % | +9 % |
| Netherlands and Sweden | 152,000 | 46,800 | 24.3 % | +14 % |
| Poland service centre | 31,000 | 18,000 | 6.0 % | −6 % |
| Norway, United Kingdom and Switzerland | 157,000 | 54,000 | 25.8 % | +11 % |
| Unallocated | 30,000 | 0 | 3.7 % | −38 % |
Showback for 2026-Q3, total EUR 818,000. Figures are illustrative.
Quarterly showback lets each entity's finance function reconcile the figures with its own use before the annual chargeback turns them into an invoice, because a charge on an allocation nobody has checked is disputed rather than paid. The unallocated row shows the effect of visibility: it fell by more than a third once the entities could see the untagged keys.
Practical guide: responding to a spend alert or a stop condition
Purpose. Turn a spend alert or breached stop condition into a governed response: the people who can act within minutes act within their authority, a service that must keep running does so by other means, and the forum receives a record it can decide on.
Roles. On-call operations role holding the stop authority; budget owner; incident manager; FinOps partner; the forum that owns the decision table.
Steps.
- At the soft alert, the gateway notifies the on-call role and the budget owner, who is informed within one hour and acknowledges within four working hours.
- The on-call role classifies the driver before changing anything, using the gateway's attribution and anomaly detection (38, OWASP, 2025): volume, a loop or retry storm (actions attempted far above actions completed), a model or prompt change, or a price change. Default: within 30 minutes for Mode 5, within the working day for Modes 3 and 4.
- Within the options the record configures, the on-call role acts alone: invoke the fallback, reduce scope, or pause the system.
- Raising the envelope or switching model needs the budget owner; changing the mandate, adding a tool or restarting a high-risk system after a hard stop waits for the forum, as Chapter 13 provides.
- At the hard cap the gateway acts without a person. The on-call role confirms within 15 minutes that the fallback is serving and no half-completed actions remain in the system of record.
- Inform users and dependent services of the fallback and the review time; a statutory service runs through its manual path.
- Record the event within the working day. Where DORA or NIS 2 applies, the incident manager classifies on the statutory clock; the forum does not decide whether to report.
- Put the record on the forum's next agenda with the decision requested from the decision table, and carry the corrective actions into the record and the gateway.
These time limits suit a Mode 5 agent acting on a system of record; a low-risk Mode 4 assistant may run them in hours. Adapt them in the record, not in the moment.
Codified artefact. The stop record below, written to incidents/spend/.
Definition of done. Budget owner notified within the limit; driver classified; fallback confirmed; record merged within the working day; forum decision recorded with a review date.
Worked example: stop record after an agent loop
Illustrative example. On the morning recorded below, a release of Hansa Mutual's core claims system API added a mandatory field to the routing call. The claims-triage agent's route actions began failing, the agent retried each one, and the cost per completed action rose from cents to euros within minutes. The daily hard cap paused the agent before the budget owner had replied.
# incidents/spend/SPD-2026-007.yaml
incident: SPD-2026-007
related: {ict_incident: INC-2026-0412, decision_record: AIDR-0024}
system: {name: claims-triage agent, usage_mode: 5, markets_affected: [DE, NL, SE, NO]}
detection:
  soft_alert: {fired: 2026-09-22T09:52+02:00}
  hard_cap: {threshold: "daily consumption EUR 1300 (weekly envelope EUR 6500)", fired: 2026-09-22T10:14+02:00}
diagnosis:
  cause_category: retry storm
  trigger: claims-core API release added mandatory field; route call returned HTTP 422
impact:
  actions_attempted: 6184
  actions_completed: 194
  cost_in_window_eur: 965
  claims_delayed: 418
  claims_past_handling_deadline: 0
actions:
  - {at: "10:06", role: on-call operator, action: classified as retry storm}
  - {at: "10:14", role: gateway, action: hard cap reached; agent paused; fallback invoked}
  - {at: "10:31", role: Head of Claims Operations, action: replied; pause to stand}
  - {at: "11:02", role: incident manager, action: opened INC-2026-0412; DORA Article 18 classification started}
forum_review: {forum: AI Governance Board, date: 2026-10-08, decision_requested: approve with conditions}
corrective_actions:
  - {id: CA-1, action: "retry budget of 2 per action, then route to handler queue"}
  - {id: CA-2, action: circuit breaker after 20 validation errors in 60 s}
The actions block shows that the gateway stopped the agent at 10:14 and the budget owner replied at 10:31, so the stop did not depend on a person being at a desk, which is the evidence the board needs before letting the agent resume. The impact block pairs the cost with the service figures, 418 claims delayed and none past deadline. A record that showed only EUR 965 would invite the wrong decision in either direction: too small to matter, or large enough to retire a system that failed safely.
Handling uncertain benefits honestly
Optimism does its damage on the benefits side, because the numbers are easy to produce and hard to check. Five practices keep the forum honest.
Separate realised benefits from forecasts. Show forecast and realised in two columns, and never let a forecast migrate into the realised column without a measurement behind it.
Record assumptions and confidence. The Green Book's advice to derive optimism-bias adjustments from historical forecast errors (213, HM Treasury, 2026) is the empirical version of this discipline: the organisation's own record is the best evidence of how far to trust its next estimate.
Do not count theoretical time savings as cash. The UK government's Microsoft 365 Copilot experiment, Case 7 in Chapter 18, produced a self-reported daily time saving (203, UK Government Digital Service, 2025), whereas a departmental evaluation of part of the same pilot, with control groups and observed tasks, found no evidence that the time saved had improved productivity (204, Department for Business and Trade, 2025). Minutes saved become money only if posts are not filled, work is redirected to something the organisation values, or a service is delivered noticeably faster. Chapter 16's benefit record for Nordvik Region kept the survey figure but excluded it, which is the right default.
Measure displacement, quality and workload effects. Work that an AI system takes from one desk often lands on another, such as the reviewer or the complaints team. Forsgren, Humble and Kim showed that output measures reward the wrong behaviour unless paired with stability measures (70, Forsgren et al., 2018); the AI version is a throughput gain paired with a quality floor.
Do not scale on adoption alone. The MIT NANDA report found that general-purpose chat tools were widely adopted and mainly improved individual productivity rather than organisational results (212, Challapally et al., 2025), and Chapter 15 warned against dashboards that count log-ins. High usage of a system whose outputs are corrected or ignored is a cost; the scale decision therefore requires the unit of value, the baseline and the realised benefit.
Fair comparisons: build, buy, reuse, non-AI and do nothing
The forum should ask which option for the objective is the best use of the money, and whether AI is one of them. The Green Book makes business as usual the benchmark and adds a do-minimum option (213, HM Treasury, 2026); the NIST framework requires viable non-AI alternatives to be considered (MANAGE 2.1) (36, NIST, 2023); and the Vademecum allows least-cost, cost-effectiveness or multi-criteria analysis where a full cost-benefit analysis is not proportionate (214, European Commission, 2021).
The options are usually five: build on a controlled platform, buy a vendor system or hosted model service, use AI features already in licensed software, solve the problem without AI, and do nothing. Each is compared on the same unit of value, period and quality constraints, with the costs that AI options tend to hide:
- Lock-in and exit. Chapter 7 showed how to price an exit plan. Pan and colleagues' analysis of on-premises deployment against commercial model services (112, Pan et al., 2025) shows how break-even depends on usage volume, model size and the prices of the commercial service compared against, so a forum should ask to see the assumptions.
- Supplier terms. Storment notes that headline subscription pricing on AI-native tools is no longer a reliable budgeting signal and that the commercial model resembles a capacity commitment (209, Storment, 2026); compare the terms governing price changes, model retirement and data use.
- Sovereignty and capability already paid for. The comparison carries the cost of the controls Chapter 6's position on model origin requires, and says what a built application adds over an embedded assistant already licensed.
- Public procurement rules. Directive 2014/24/EU requires award on the most economically advantageous tender, identified on price or cost using a cost-effectiveness approach such as life-cycle costing, and permits a best price-quality ratio including qualitative, environmental and social aspects, with accessibility named among them (Article 67); Article 68 defines life-cycle costing to cover acquisition, use including energy, maintenance, end-of-life costs and verifiable environmental externalities (9, European Union, 2014). Evaluating on first-year licence price alone departs from that method.
Worked example: an option comparison before renewal
Illustrative example. Hansa Mutual's monthly risk report in Chapter 16 flagged a document-extraction service, 6 per cent of AI spend, that lacked a tested exit plan. Its contract renews in 2027, and the AI Governance Board asked for a comparison first. The quality constraint, extraction accuracy on the group's golden dataset, is the same for every option.
| Option | Three-year cost (EUR) | Unit cost (p50) | Exit and sovereignty | Forum's reading |
|---|---|---|---|---|
| Renew hosted service | 1.9m to 2.4m, price rises capped at 8 per cent a year | 0.11 | Proprietary schema; exit plan untested; DORA Article 28 exit plan required | Admissible only with a tested exit plan |
| Open-weight model on the group platform | 2.1m to 2.9m | 0.09 at full utilisation, 0.19 at pilot volume | Weights held by the group; Frankfurt | Preferred if utilisation reaches 60 per cent |
| Rules-based for structured forms, hosted model for the rest | 1.5m to 1.8m | 0.04 structured, 0.14 unstructured | Smaller provider dependency | Preferred for structured forms, 70 per cent of volume |
| Do nothing: manual extraction | 3.1m to 3.4m in staff time | 0.52 | None | Baseline |
The shape matters more than the figures: one unit of value, one quality constraint, a measured baseline, and exit cost and sovereignty on the same page as price.
The governance forum's decision table
A forum that meets quarterly cannot reconstruct every system's economics from first principles; it needs a small set of outcomes and the evidence for each. Hansa Mutual's AI Governance Board and Nordvik Region's regional executive committee both use the table below, adapted to their tiers.
| Decision | Conditions that support it | Record produced |
|---|---|---|
| Approve | Unit of value and baseline recorded; forecast within envelope; alternatives compared; stop conditions named; risk class and legal basis settled | Tranche release; state transition |
| Approve with conditions | One input missing or weak, such as an untested exit plan or a forecast error above 25 per cent; owner and date named | Exception record with expiry (Chapter 16) |
| Pause | Stop condition met; hypothesis unsupported after the agreed period; supplier change invalidates the forecast; consultation or legal basis incomplete | Pause decision with resume criteria |
| Scale | Benefit shown in a comparison group; p90 unit cost within ceiling; high case affordable; exit plan costed; consultation recorded | Scale tranche; envelope revised |
| Retire or redesign | Value does not justify cost; a cheaper option meets the unit of value; supplier basis changed; superseded by a licensed capability | Retirement record (Chapter 21) or redesign intake |
Two habits make the table work: every decision names the next review date, so that "approve" never means "approve indefinitely", and the forum records what evidence it did not have, so that the next review starts from the gap.
Worked example: the decision table as policy
Illustrative example. Hansa Mutual keeps the table as a policy file beside the board's decision-rights file, so that the pipeline pre-classifies each agenda item from the investment and value record.
# governance/forums/ai-governance-board.economics-decisions.yaml  (Hansa Mutual, illustrative)
forum: ai-governance-board
applies_to: {usage_modes: [4, 5]}        # capability owners apply the same table to seat-based modes
outcomes:
  approve:
    requires:
      - "unit_of_value.baseline != null"
      - "forecast.high_eur <= cost_envelope.amount_eur"
      - "options.compared == true"
      - "stop_conditions.count >= 1 and stop_authority != null"
  approve_with_conditions:
    requires:
      - "approve.requires met except one, or exit_plan.tested == false"
      - "conditions[*].owner != null and conditions[*].due != null"
  pause:
    requires_any: ["thresholds.breached == true", "supplier.notice_invalidates_forecast == true"]
  scale:
    requires:
      - "realised.hypothesis_supported == true and realised.comparison_group == true"
      - "cost_per_unit.p90 <= thresholds.unit_cost_p90"
      - "exit_plan.costed == true"
  retire:
    requires_any: ["realised.value_eur < realised.cost_eur over review.period", "supplier.basis_changed == true"]
rules:
  missing_evidence_becomes: approve_with_conditions
  max_condition_days: 90
  every_decision_records: [review_date, evidence_not_available]
enforcement:
  pipeline_check: scripts/check_economics_decisions.py
The policy does not take the decision; it tells the forum which decision the evidence supports and names the empty fields. An item without a tested exit plan is classified approve_with_conditions before anyone reads it, and a condition running past 90 days fails the check.
Practical guide: running the renewal or retirement review
Purpose. Decide on evidence, before the contract decides for you, whether an AI system continues, is rebuilt or stops.
Roles. Budget owner; procurement; FinOps partner; architect; risk owner; for a public authority, whoever prepares the elected committee's papers.
Steps.
- Schedule the review at least 120 days before the contract renewal or review date, plus any notice period longer than 90 days. A public tender needs it a year ahead, a seat-based tool a quarter.
- Assemble realised value against the forecast at the last gate; an unmeasured benefit stays in the forecast column.
- Re-run the option comparison on one unit of value and quality constraint, with exit cost and price-change terms beside price.
- Check supplier change notices and model retirement dates for the renewal period.
- Cost decommissioning for every option that stops or shrinks the system, as Chapter 21's retirement record lists.
- Apply the decision table and record missing evidence; missing evidence yields approve with conditions, never approve.
- Record the decision as a minute in version control with conditions, owners, dates and the next review date, and align any renewal term with that date.
- For a public authority, write a summary the elected committee can read, in the language of the service.
Codified artefact. The decision minute and the updated investment and value record, merged in one pull request.
Definition of done. The minute is merged, every condition has an owner and a date within 90 days, the contract term matches the review date, and decommissioning cost is in the record.
Worked example: decision minute for a renewal review
Illustrative example. The AI Governance Board decided on the document-extraction service compared above. It chose rules-based extraction for structured forms and a bounded open-weight pilot for the remainder, and made renewal of the hosted service conditional on an exit plan tested under Article 28(8) of DORA (3, European Union, 2022).
# decisions/2026/DEC-2026-044.yaml  (Hansa Mutual, illustrative)
id: DEC-2026-044
forum: ai-governance-board
meeting: 2026-11-11
evidence_pack: governance@7c04e2a
subject: UC-2024-012 document-extraction service, renewal review before 2027-03-31
consenting: {chief-risk-officer: consent_given}
vote: {for: 5, against: 0, abstain: 0}
evidence:
  option_comparison: portfolio/comparisons/UC-2024-012-renewal-2027.yaml
  exit_plan: exit/EXIT-007.yaml                                 # draft, untested; due 2026-12-15
decisions:
  - {option: rules-based for structured forms, decision: scale}
  - {option: open-weight model, decision: approve_with_conditions, scope: bounded pilot}
  - {option: hosted service, decision: approve_with_conditions, scope: "unstructured remainder, 12-month term"}
  - {option: do nothing, decision: rejected}
conditions:
  - {id: C1, text: Exit plan EXIT-007 completed and rehearsed, owner: head-procurement, due: 2027-02-05}
  - {id: C2, text: Open-weight pilot limited to 15 per cent of unstructured volume, owner: head-ai-platform, due: 2027-02-05}
  - {id: C3, text: "Renewal for 12 months with the 8 per cent price-change cap, signature after C1", owner: head-procurement, due: 2027-02-09}
review_date: 2027-02-17
records_to_update:
  - portfolio/exceptions/EXC-2026-021.yaml   # approve_with_conditions for the hosted renewal, expires 2027-02-05
approved_by_merge: PR-1263
The minute makes auditable which evidence the board read, by file and commit; which options it weighed, so that a later board cannot be told the alternatives were never considered; who owes what by when, within the 90 days the policy allows; and the next review date, so that approval has a term. The chief risk officer's consent and the vote are recorded against the terms of reference of Chapter 13, and the merge through PR-1263 is the signature.
Across the usage modes
The cost model, and therefore the proportionate control, differs by usage mode (usage-mode matrix). A forum that applies one template to an ambient feature and an autonomous agent will either strangle the first or under-govern the second.
| Mode | Cost model | Envelope and approval | Stop arrangement |
|---|---|---|---|
| Mode 0 Ambient AI | Bundled into licences | Reviewed as a supplier change | Disable the feature |
| Mode 1 Conversational assistants | Per seat | Annual seat budget; approval of tiers, not of use | Remove seats |
| Mode 2 Embedded workplace assistants | Per seat, sometimes plus consumption for agent features | Seat budget plus envelope for agent features | Disable agent features per tenant |
| Mode 3 Agentic work tools | Seat plus variable consumption | Envelope per team; approval for premium models and new connectors | Gateway quota; revoke connector |
| Mode 4 Built AI applications | Consumption plus platform charge | Investment and value record; gates as in this chapter | Fallback at hard stop; pause by on-call |
| Mode 5 Autonomous production agents | Consumption scaling with actions | Envelope per period and cost per completed action; approval of mandate and every write tool | Hard cap with fallback; forum review of every stop |
The gradient is one of agency and marginal cost. Where a human chooses each use at a fixed seat price, governance is about access and an annual review; where a system acts without a human and every action costs money, the platform enforces the envelope and the stop path is tested before go-live.
Worked example: team consumption envelope for agentic work tools
Illustrative example. Hansa Mutual's engineering teams use agentic work tools through the group platform, with sensitive information handled only by self-hosted models in Frankfurt. The gateway reads this envelope.
# finops/envelopes/mode3/platform-engineering.yaml
team: platform-engineering              # group platform team, Hamburg
usage_mode: 3
cost_centre: GRP-IT-4120
period: monthly
seats: 14
envelope_eur: 5600                      # about EUR 400 per seat
thresholds: {soft_alert: 0.80, hard_cap: 1.00}
at_hard_cap:
  premium_models: disabled              # hosted premium tiers off for the rest of the period
  self_hosted_models: available         # hansa-dc-frankfurt
per_task:
  token_ceiling: 400000
  max_retries_per_step: 2
  loop_rule: identical tool call with identical arguments three times stops the task
connectors: {catalogue_only: true, approver: capability owner; CISO consent for write access}
owner: Head of Platform Engineering
The team is the right grain for Mode 3, because consumption follows the task: one engineer on a long migration can use in a day what a colleague uses in a month, and the team lead can rebalance the work. Per-person spend records would also be monitoring data about employees, which in Hansa's German, Dutch and Swedish entities brings works councils and unions into a question that a team envelope answers without them.
Public money and public value
A public authority spends money that is not its own, on services people cannot take elsewhere, under duties private organisations do not carry. Five considerations follow.
Public money needs a public standard of appraisal. The Green Book holds that monitoring and evaluation assure that public money is used effectively and that an evaluation plan should exist before final approval (213, HM Treasury, 2026); the Vademecum recommends economic appraisal of EU co-financed investment, in proportion to its size and risk, and uses it as the reference for monitoring and ex post evaluation (214, European Commission, 2021). A regional authority is bound by neither, but it will struggle to defend spend to its auditor-general without an appraisal of comparable quality.
Service outcomes, not staff time, are the measure. A benefits-triage system's value lies in faster and more consistent decisions and fewer upheld appeals; the caseworker hours it saves are one input. The OECD's review of AI in core government functions likewise holds that governments need to evaluate AI against public-sector outcomes and trust rather than efficiency alone (126, OECD, 2025).
Procurement is the comparison. For a public body the fair comparison is the award method the Directive prescribes, with life-cycle costing and accessibility available as criteria (9, European Union, 2014), and the tender should ask bidders for the data needed to compute cost per unit of value over the contract's life.
Accessibility is value, not overhead. Article 16 of the AI Act requires providers of high-risk systems to meet the accessibility requirements of Union law (1, European Union, 2024). The cost of an accessible alternative channel is therefore part of the AI option's cost, and a system that saves money by serving only the residents who can use it has transferred cost to those least able to bear it.
Statutory duties shape what can be stopped. An algorithm-register entry of the kind Chapter 17 describes should state the system's cost basis and review date. A system supporting a statutory service cannot simply be switched off when its envelope is exhausted, so its fallback must keep the service running, and each tranche must produce a decision point before the next appropriation is set.
Practical guide: appraising an AI investment with public money
Purpose. Produce an appraisal that an auditor, an elected committee and a resident can each check before a budget year is committed.
Roles. Service owner as budget owner; finance; procurement; legal and the data protection officer; the official presenting to the elected committee.
Steps.
- State the service outcome and the residents affected before any staff-time figure.
- Record business as usual as the measured baseline, neither idealised nor inflated (213, HM Treasury, 2026).
- Compare do nothing, do minimum, a non-AI option and each AI option on one unit of value over the contract term plus exit; below the delegated threshold, use cost-effectiveness or multi-criteria analysis (214, European Commission, 2021).
- Describe unmonetisable costs and benefits in words with an observable indicator, such as accessibility or time to decision.
- Apply an optimism-bias adjustment from the authority's own forecast record. Without one, add a third to costs and remove a third from benefits until two measured periods replace it; adapt the uplift to risk appetite.
- In a procurement, ask tenderers for life-cycle costing data and price-change terms, as Directive 2014/24/EU Articles 67 and 68 describe (9, European Union, 2014).
- Plan and cost evaluation before approval, with the first measurement within two quarters of go-live.
- Fit each tranche inside one budget year with a decision point one quarter before the next appropriation, and name the fallback for a statutory service.
- Write a two-page plain-language summary for elected members and residents.
Codified artefact. An appraisal file, portfolio/appraisals/<use-case>.yaml, from which the pipeline renders the summary.
Definition of done. The file is merged, finance has signed the baseline and adjustment, the evaluation plan has an owner and date, and the summary is attached to the committee paper.
Worked example: appraisal summary for an elected committee
Illustrative example. Nordvik Region's internal staff assistant (UC-2026-061, AIDR-0211, a hosted open-weight model under contract NR-2026-031, EEA only) comes before the regional executive committee for 2027 funding. The committee's minutes are public, so the summary is written for elected members and residents; every monetary figure is illustrative.
# Staff writing assistant: funding decision for 2027
Portfolio entry UC-2026-061 · Decision record AIDR-0211 · Committee paper 2026-11-19

## What it cost in 2026 and what we ask for 2027 (illustrative figures)
2026: EUR 395,000 spent against an approved ceiling of EUR 440,000.
2027: a ceiling of EUR 480,000, with a forecast of EUR 390,000 to 470,000.
A typical approved letter cost about EUR 2.30 in 2026.

## What was measured
Between April and June 2026, drafting a standard letter took 21.5 minutes for
staff with the assistant and 27.0 minutes for about 800 colleagues who had not
yet received it. A staff survey reported larger savings; we do not count it.

## What has not been shown
No cash saving is claimed. No post has been removed and none is planned to be.
The 5.5 minutes per letter went into case handling and into checking drafts.
Questions to second-line support rose by 6 per cent. The two groups handled
different mixes of cases, so the benefit may be smaller than measured.

## Risks and when we would stop
We pause the assistant, and staff return to templates, if spending reaches the
ceiling, if second-line questions stay more than 10 per cent above the 2026
level for two months, or if any data is found outside the EEA.

## Recommendation
Continue for 2027 with the ceiling above and a decision point in October 2027,
before the 2028 budget is set.
The section headed "What has not been shown" is the one a committee is least used to reading and the one that protects the Region most. A summary listing only the measured benefit invites readers to assume a saving nobody will find in the accounts, whereas stating that no post was removed keeps the benefit honest and the later evaluation checkable.
Nordvik Region and Hansa Mutual
Nordvik Region governs few systems on a fixed budget. Its citizen-service assistant runs on accelerators a European hosting provider reserves for it, so its constraint is capacity rather than a variable bill: the envelope is the contract, the risk is under-utilisation, and the unit cost falls as volume rises. Its benefits-triage system is procured, so its economic levers are the tender and the contract: life-cycle costing in the award, a price-change clause, exit assistance and the data to compute cost per decision supported. Decisions above the delegated threshold go to the regional executive committee, and the measure of value is service to applicants, not hours.
Hansa Mutual governs a larger estate through a centrally funded group platform with quarterly showback and annual chargeback. Its decision table is read by the AI Governance Board for Modes 4 and 5 and by capability owners for the seat-based modes, and every stop of the claims-triage agent is reviewed by the board. DORA Article 5(2)(g) requires each EU entity's management body to allocate and review the budget for digital operational resilience (3, European Union, 2022), so the entity projections of Chapter 16 carry each entity's share of AI cost and exit plans, and that duty triggered the document-extraction comparison. Hansa's exposure is scale and agency, since a loop or price change moves money faster than a committee meets; Nordvik's is the opposite: too few systems to learn from, and a public that will ask what each one cost.
Summary
AI systems built on large language models cost what they consume, and consumption is decided at run time by volumes, context length, retries and agent loops, model choice, capacity, assurance, supplier prices and the cost of operating and retiring. Governing that cost is a matter of ownership before metering: a named budget owner holds the envelope and the benefit together, finance owns the forecast and allocation, procurement the terms, and the stop authority sits with the people who can act within minutes.
Value is established by a unit of outcome the business recognises, a measured baseline, full lifecycle and human costs, and quality, accessibility and public value weighed together. Realised benefits are kept apart from forecasts, self-reported time is not counted as cash, and every option, including non-AI alternatives and doing nothing, is compared on the same unit with exit cost and sovereignty beside price.
The investment gates read one investment and value record, and the decision table turns the evidence into five outcomes: approve, approve with conditions, pause, scale, or retire. Controls are proportionate to usage mode, from seat review to gateway-enforced envelopes for autonomous agents, and five practical guides make the chapter directly usable. Public authorities carry all of this with public money and public duties, which Chapter 17 takes up in full: legal basis, the duty to give reasons, algorithm registers, procurement, sovereignty and fundamental rights impact assessment.
Sources
- FinOps Foundation (2026). FinOps for AI Overview. FinOps Foundation, last updated 28 October 2026. (207, FinOps Foundation, 2026)
- FinOps Foundation. FinOps Framework Overview. FinOps Foundation, living page. (208, FinOps Foundation, n.d.)
- Storment, J. R. (2026). Token Economics: The Atomic Unit of AI Value. FinOps Foundation Insights, 10 May 2026. (209, Storment, 2026)
- Linux Foundation (2026). Linux Foundation Announces the Intent to Launch the Tokenomics Foundation to Establish Open Standards for AI Cost Management. Press release, 3 June 2026. (210, Linux Foundation, 2026)
- FinOps Foundation (2026). State of FinOps 2026 Report. FinOps Foundation. (211, FinOps Foundation, 2026)
- OWASP Foundation (2025). OWASP Top 10 for Agentic Applications for 2026. OWASP GenAI Security Project, 9 December 2025. (84, OWASP, 2025)
- OWASP Foundation. OWASP Top 10 for Large Language Model Applications, 2025 edition. OWASP GenAI Security Project. (38, OWASP, 2025)
- European Parliament and Council of the European Union. Regulation (EU) 2024/1689 laying down harmonised rules on artificial intelligence (Artificial Intelligence Act). Official Journal of the European Union, 12 July 2024. (1, European Union, 2024)
- Stanford Institute for Human-Centered Artificial Intelligence. Artificial Intelligence Index Report 2025. Stanford University, April 2025. (60, Stanford HAI, 2025)
- OpenAI (2026). Deprecations. OpenAI API documentation, latest entry 14 October 2026. (113, OpenAI, 2026)
- Microsoft (2026). Foundry Models lifecycle and support policy. Microsoft Learn, 24 July 2026. (114, Microsoft, 2026)
- Sculley, D., Holt, G., Golovin, D., Davydov, E., Phillips, T., Ebner, D., Chaudhary, V., Young, M., Crespo, J.-F. & Dennison, D. (2015). Hidden Technical Debt in Machine Learning Systems. Advances in Neural Information Processing Systems 28. (48, Sculley et al., 2015)
- National Institute of Standards and Technology (2023). Artificial Intelligence Risk Management Framework (AI RMF 1.0). NIST AI 100-1, January 2023. (36, NIST, 2023)
- Challapally, A., Pease, C., Raskar, R. & Chari, P. (2025). The GenAI Divide: State of AI in Business 2025. MIT NANDA, July 2025. (212, Challapally et al., 2025)
- HM Treasury (2026). The Green Book (2026): UK Government Guidance on Appraisal. London: HM Treasury, updated 28 October 2026. (213, HM Treasury, 2026)
- European Commission (2021). Economic Appraisal Vademecum 2021–2027: General Principles and Sector Applications. Directorate-General for Regional and Urban Policy, Luxembourg: Publications Office of the European Union, September 2021. (214, European Commission, 2021)
- UK Government Digital Service (2025). Microsoft 365 Copilot Experiment: Cross-Government Findings Report. GOV.UK, 2 June 2025. (203, UK Government Digital Service, 2025)
- Department for Business and Trade (2025). Evaluation of the M365 Copilot pilot in the Department for Business and Trade. GOV.UK, 28 August 2025. (204, Department for Business and Trade, 2025)
- Forsgren, N., Humble, J. & Kim, G. (2018). Accelerate: The Science of Lean Software and DevOps. Portland, OR: IT Revolution Press. (70, Forsgren et al., 2018)
- Pan, G., Chodnekar, V., Roy, A. & Wang, H. (2025). A Cost-Benefit Analysis of On-Premise Large Language Model Deployment: Breaking Even with Commercial LLM Services. arXiv:2509.18101 (preprint), 11 November 2025. (112, Pan et al., 2025)
- European Parliament and Council of the European Union (2014). Directive 2014/24/EU on public procurement. Official Journal of the European Union, 28 March 2014. (9, European Union, 2014)
- Organisation for Economic Co-operation and Development (2025). Governing with Artificial Intelligence: The State of Play and Way Forward in Core Government Functions. OECD Publishing, Paris, 2025. (126, OECD, 2025)
- European Parliament and Council of the European Union. Regulation (EU) 2022/2554 on digital operational resilience for the financial sector (DORA). Official Journal of the European Union, 27 December 2022. (3, European Union, 2022)